Dashboards that show everything equally
When everything has the same visual weight, nothing stands out and users cannot tell what needs action. On a phone it gets worse: a desktop screen shrunk down loses what matters most.
Data products have one job: help users make better decisions, faster. Most fail at it - not because the data is wrong, but because the interface buries insights in complexity. We design data products where the right information reaches the right person at the right moment.


Designing for data is different from designing for workflows or transactions. Data products have to work for analysts who need density and precision, and for executives who need a single number they can trust. They have to handle uncertainty, incomplete data, and multiple conflicting interpretations without losing user confidence. Getting that balance right - information-rich without being overwhelming - is what makes data product design its own discipline.
Information hierarchy designed for the decision the user needs to make, not the database schema
Multiple user types served from the same data without competing for the same interface
Data visualization choices that communicate accurately without misleading
Uncertainty and data quality communicated clearly so users can calibrate their confidence
Data products that are hard to use do not just frustrate users - they generate the wrong decisions, create the wrong narratives, and undermine trust in the data itself.
When everything has the same visual weight, nothing stands out and users cannot tell what needs action. On a phone it gets worse: a desktop screen shrunk down loses what matters most.
Truncated axes, misleading color and charts that look right but say the wrong thing lead to wrong decisions. When users cannot tell whether data is current or complete, they stop using the product.
Analysts need raw data, filters and export. Executives need one number and a trend. Served by one design, both lose, and a question that should take 5 minutes takes 45.
Real data products, real decision improvement.
From analytics platforms to BI dashboards - design that makes data products work for every user type.
Shadowing and decision research show what your users ask of their data, how they handle uncertainty and where the interface misleads them.
Dashboards built around the decision, not the data available: clear hierarchy, honest charts, freshness and drill-downs in one place.
Query, exploration, reports and sharing designed for the analyst who lives in the platform and the business user who drops in.
Metrics, dimensions and reports organized the way people think about their business, so they find answers without asking.
Role-based views so engineers, analysts, managers and executives each get a product that feels built for them.
One documented library of charts, tables, filters, metrics and empty and loading states, designed for data clarity.
LUMETRIC · DASHBOARD TEST · 12 ANALYSTS
Dashboardguessing what analysts needwatching them decide
LUMETRIC · REVENUE DASHBOARD
Dashboardsix charts, all the same weightone number, and what moved it
LUMETRIC · SAVED ANALYSES
Analysesa new query for every questionthe answer opens where you are
LUMETRIC · METRICS · REVENUE
14 metrics named “revenue” rev_gross_v2 revenue_net_old …11 moreNet revenue, the one Finance reportsDefined once, used in every dashboardCertifiedOwner: FinanceUpdated dailyPinUseMetric searchfourteen metrics with one namethe one Finance reports, first
LUMETRIC · iOS · EXEC VIEW
Executive viewthe analyst’s report, shrunkthe number, the risk, the decision
LUMETRIC DESIGN SYSTEM · METRICS
No shared ruleEach screen formats the number its own way<Metric value={412318} unit="usd" delta />Symbol first · one decimal · k and M above 10,000 · the change beside itNumber formatevery team writes it its own wayone component, one rule
We understand data product development timelines. We fit in. A data product design engagement typically runs 8-12 weeks. Products with multiple user roles, complex data taxonomies, or real-time data requirements may run 12-16 weeks.
Data products are not data warehouses with a UI. They are decision support tools. Every design decision is evaluated against whether it helps the right person make the right decision faster.
Analysts, business users, and executives have fundamentally different information needs. We design systems that serve all of them without forcing compromise - through role-based views, progressive disclosure, and context-appropriate data presentation.
We apply data visualization principles rigorously - appropriate chart types, honest axes, clear uncertainty communication, and color systems that do not mislead. Data products that mislead through poor visualization are worse than no product at all.
Users who do not trust the data stop using the product. We design data freshness indicators, completeness signals, filter transparency, and data source attribution that help users calibrate their confidence in what they are looking at.
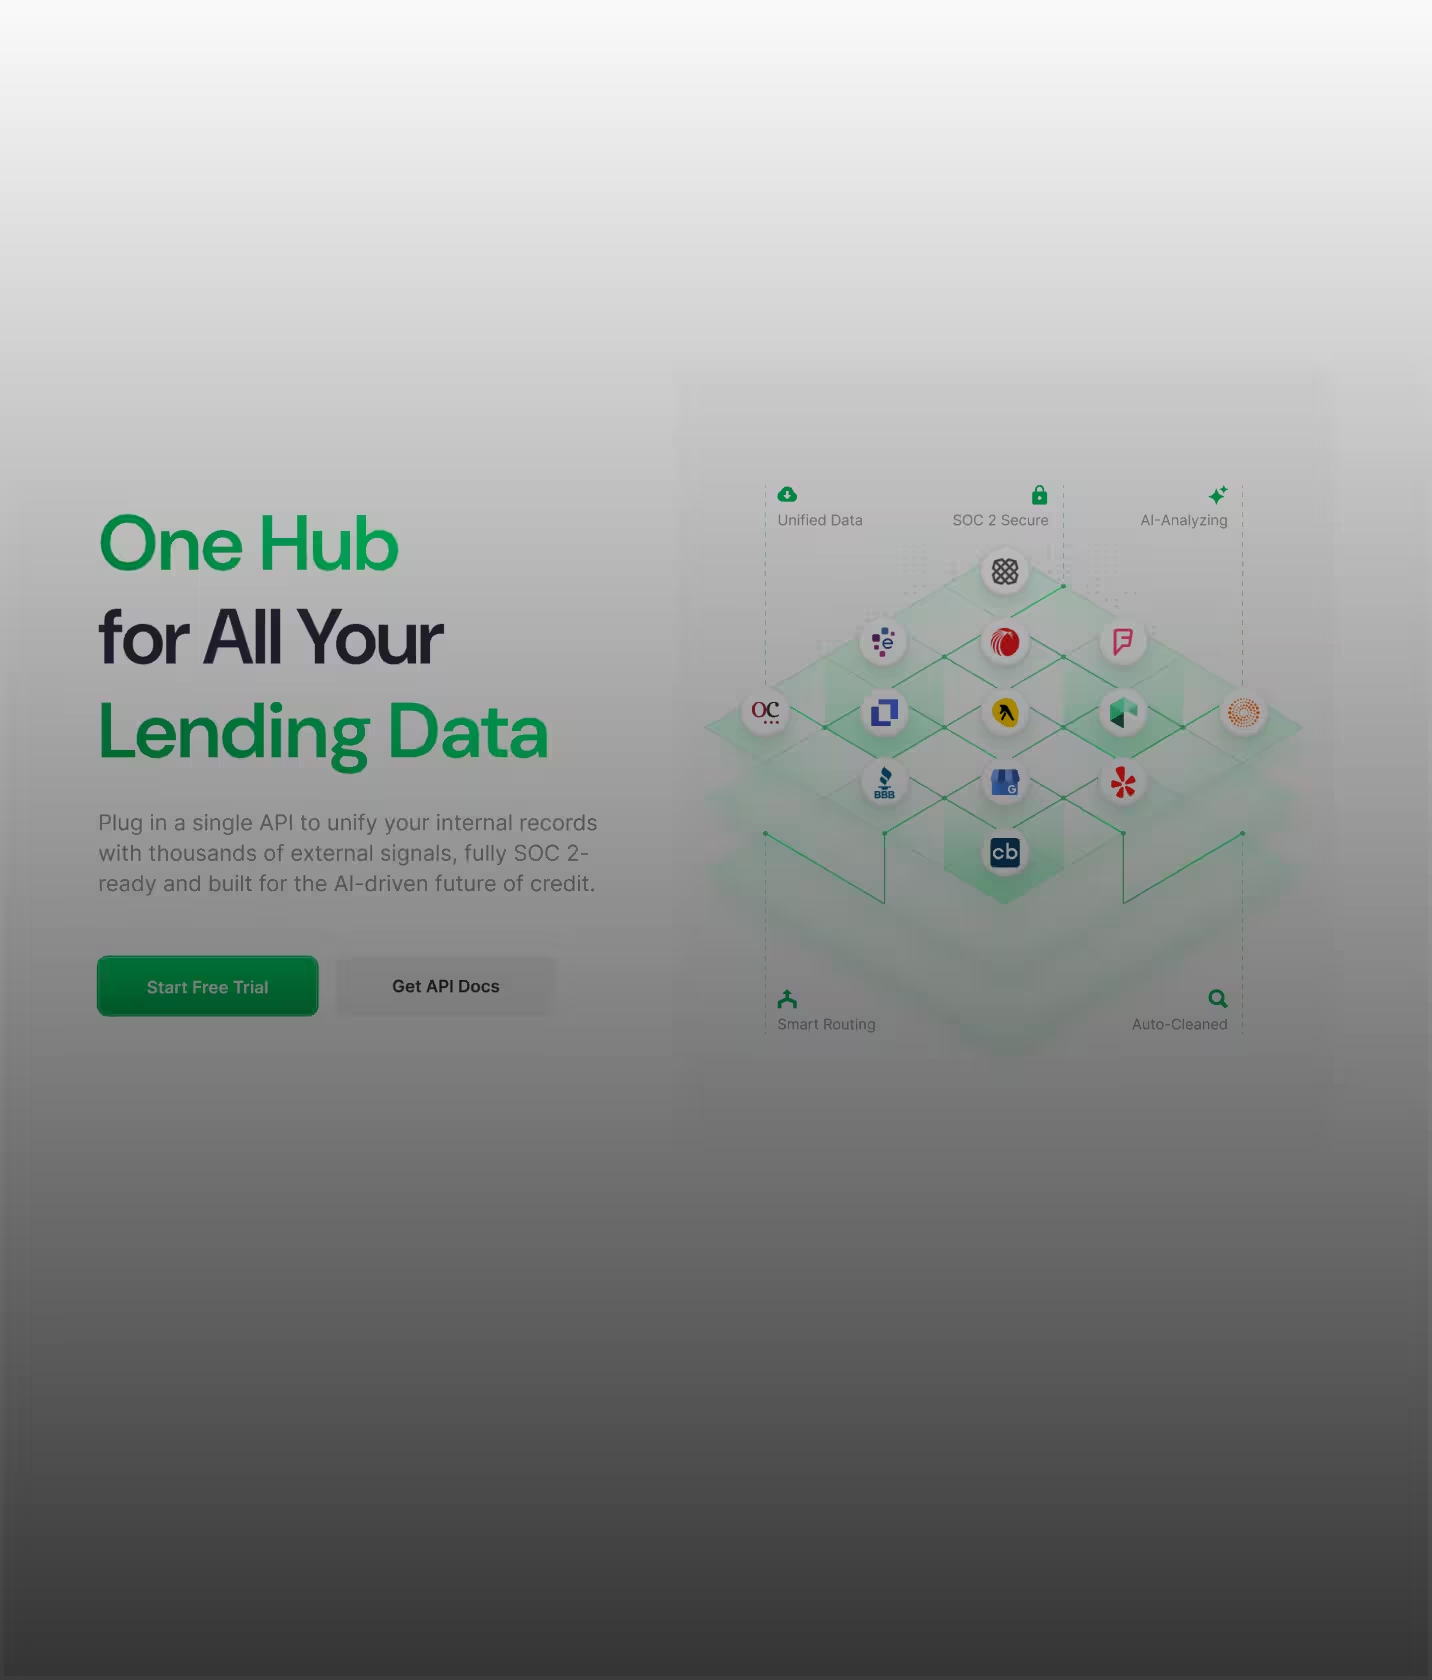

"The design work provided by Glow Design Agency completely exceeded project stakeholder expectations in terms of both quality and delivery. Their team was organized and communicative throughout the process, breaking down complex industry concepts and translating them into a sleek and useable UI."
Jon Fry·CEO & Founder at Lendflow (YC W21)
View story

“About a week ago, we went a bit viral with 10k users in 2 days and we received a lot of positive feedback about the design - so thank you Glow for that!”
Israel Benarousse·CEO, Dropcall
View story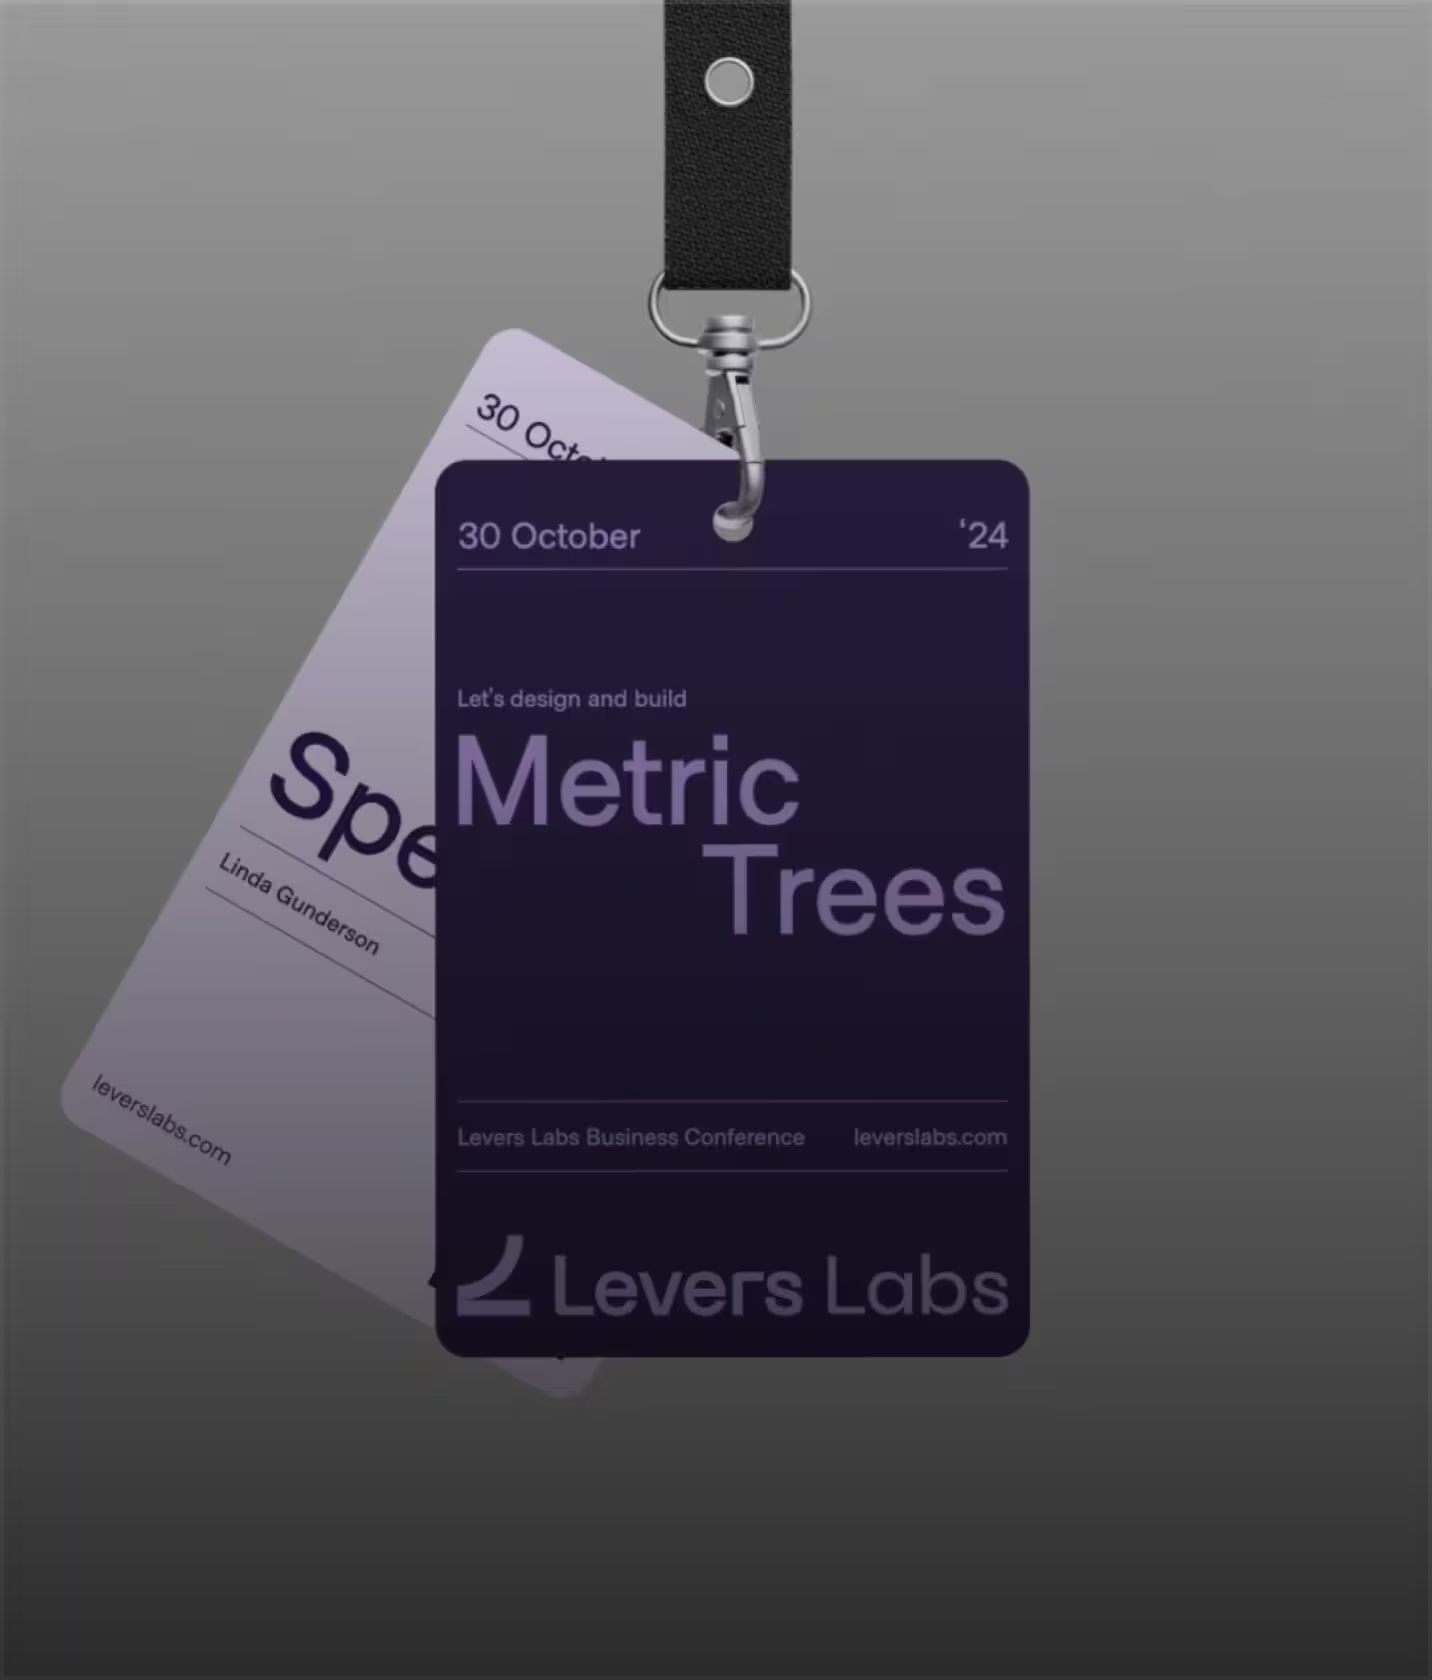

“Glow Design Agency delivered high-quality UX/UI designs that enabled the client to close more deals. Their animated video and design gained the client almost 500+ new LinkedIn followers. The team executed work on time and within budget.
Doug Marinaro·CEO, Riptide
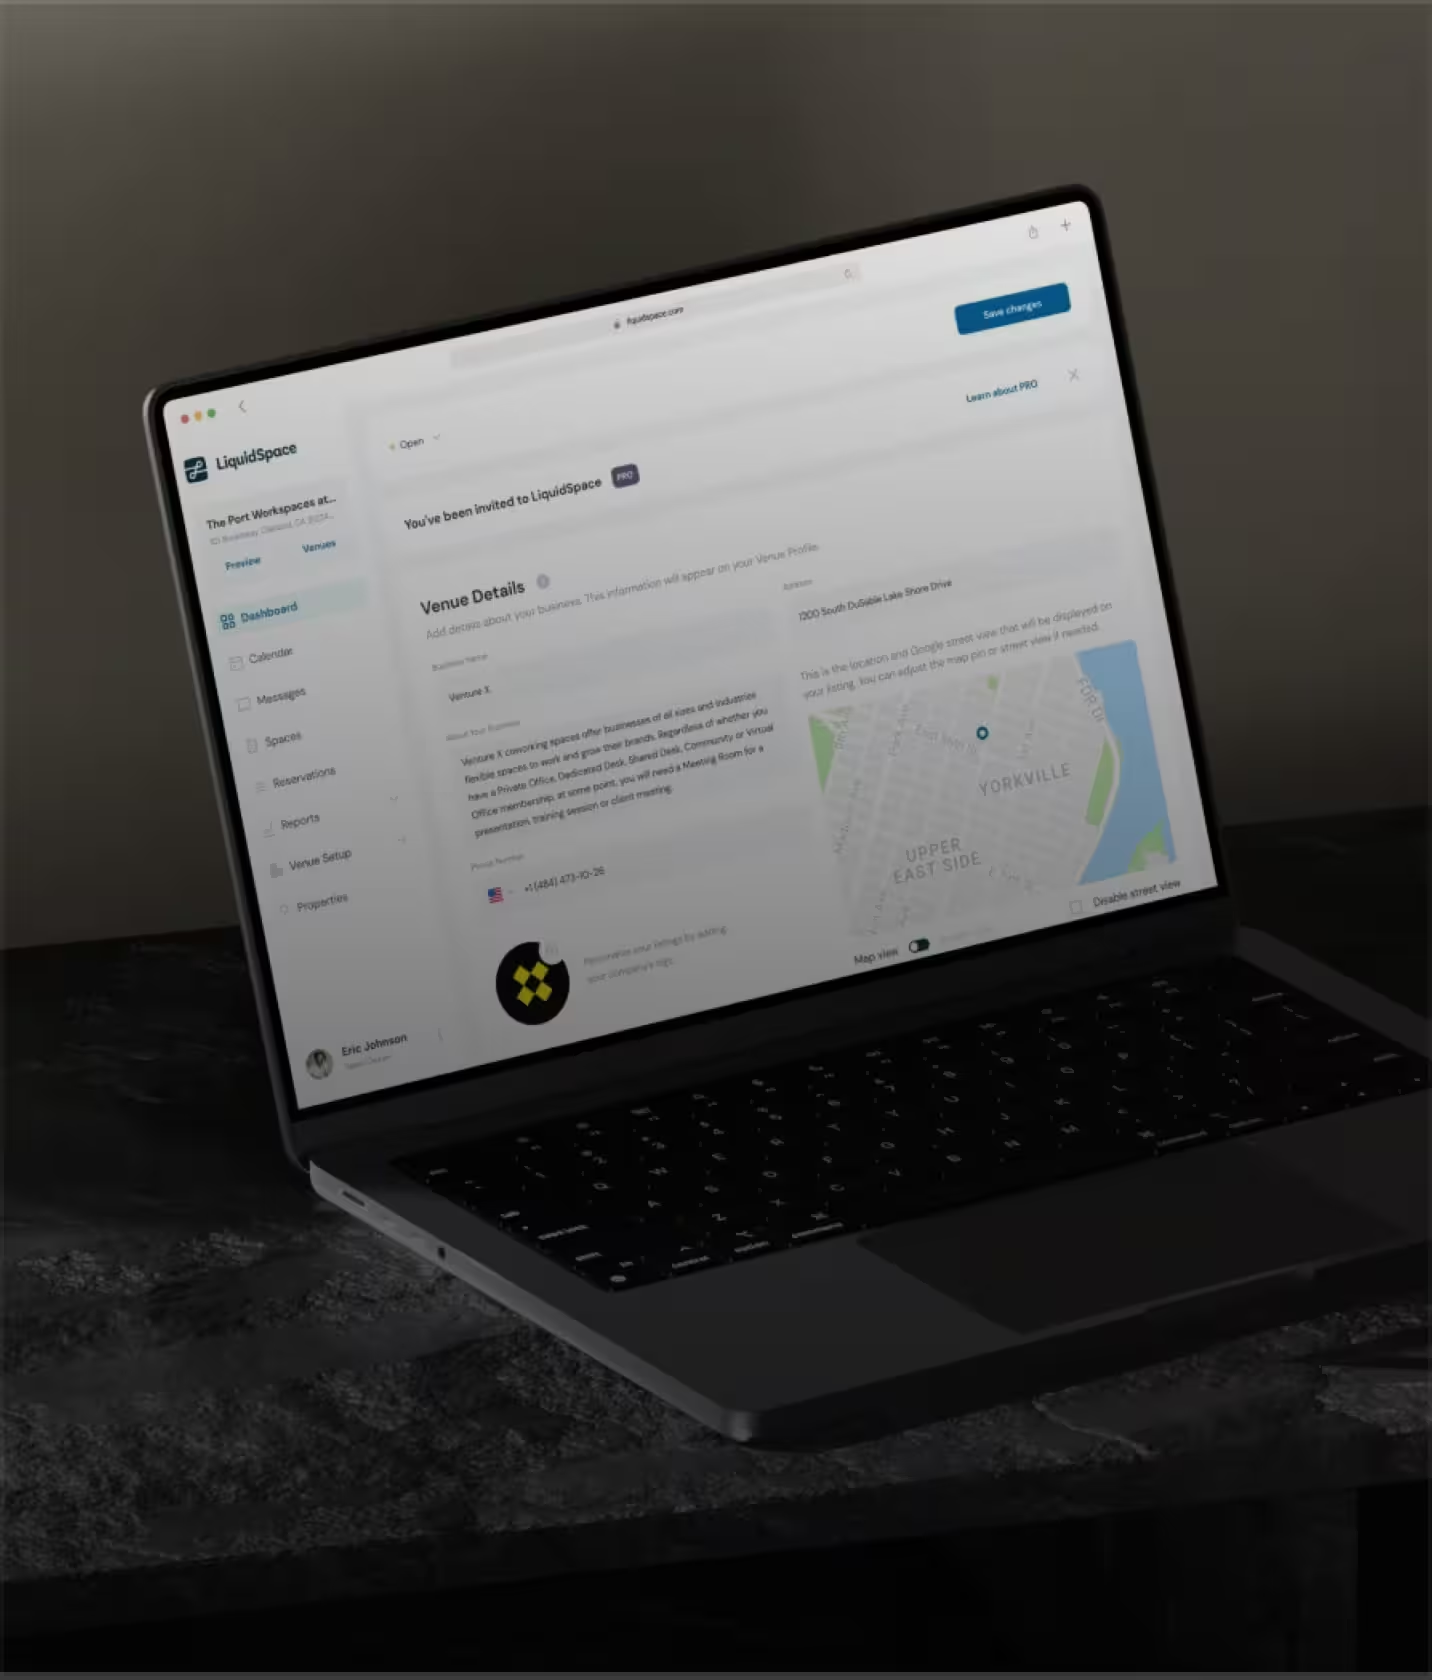

"Glow Design provided UI/UX design for a office space provider and has since expanded their role to include design updates for the site's front- and backend as well as social media visuals and animations."
Eric Zellhart·VP Product at LiquidSpace
View story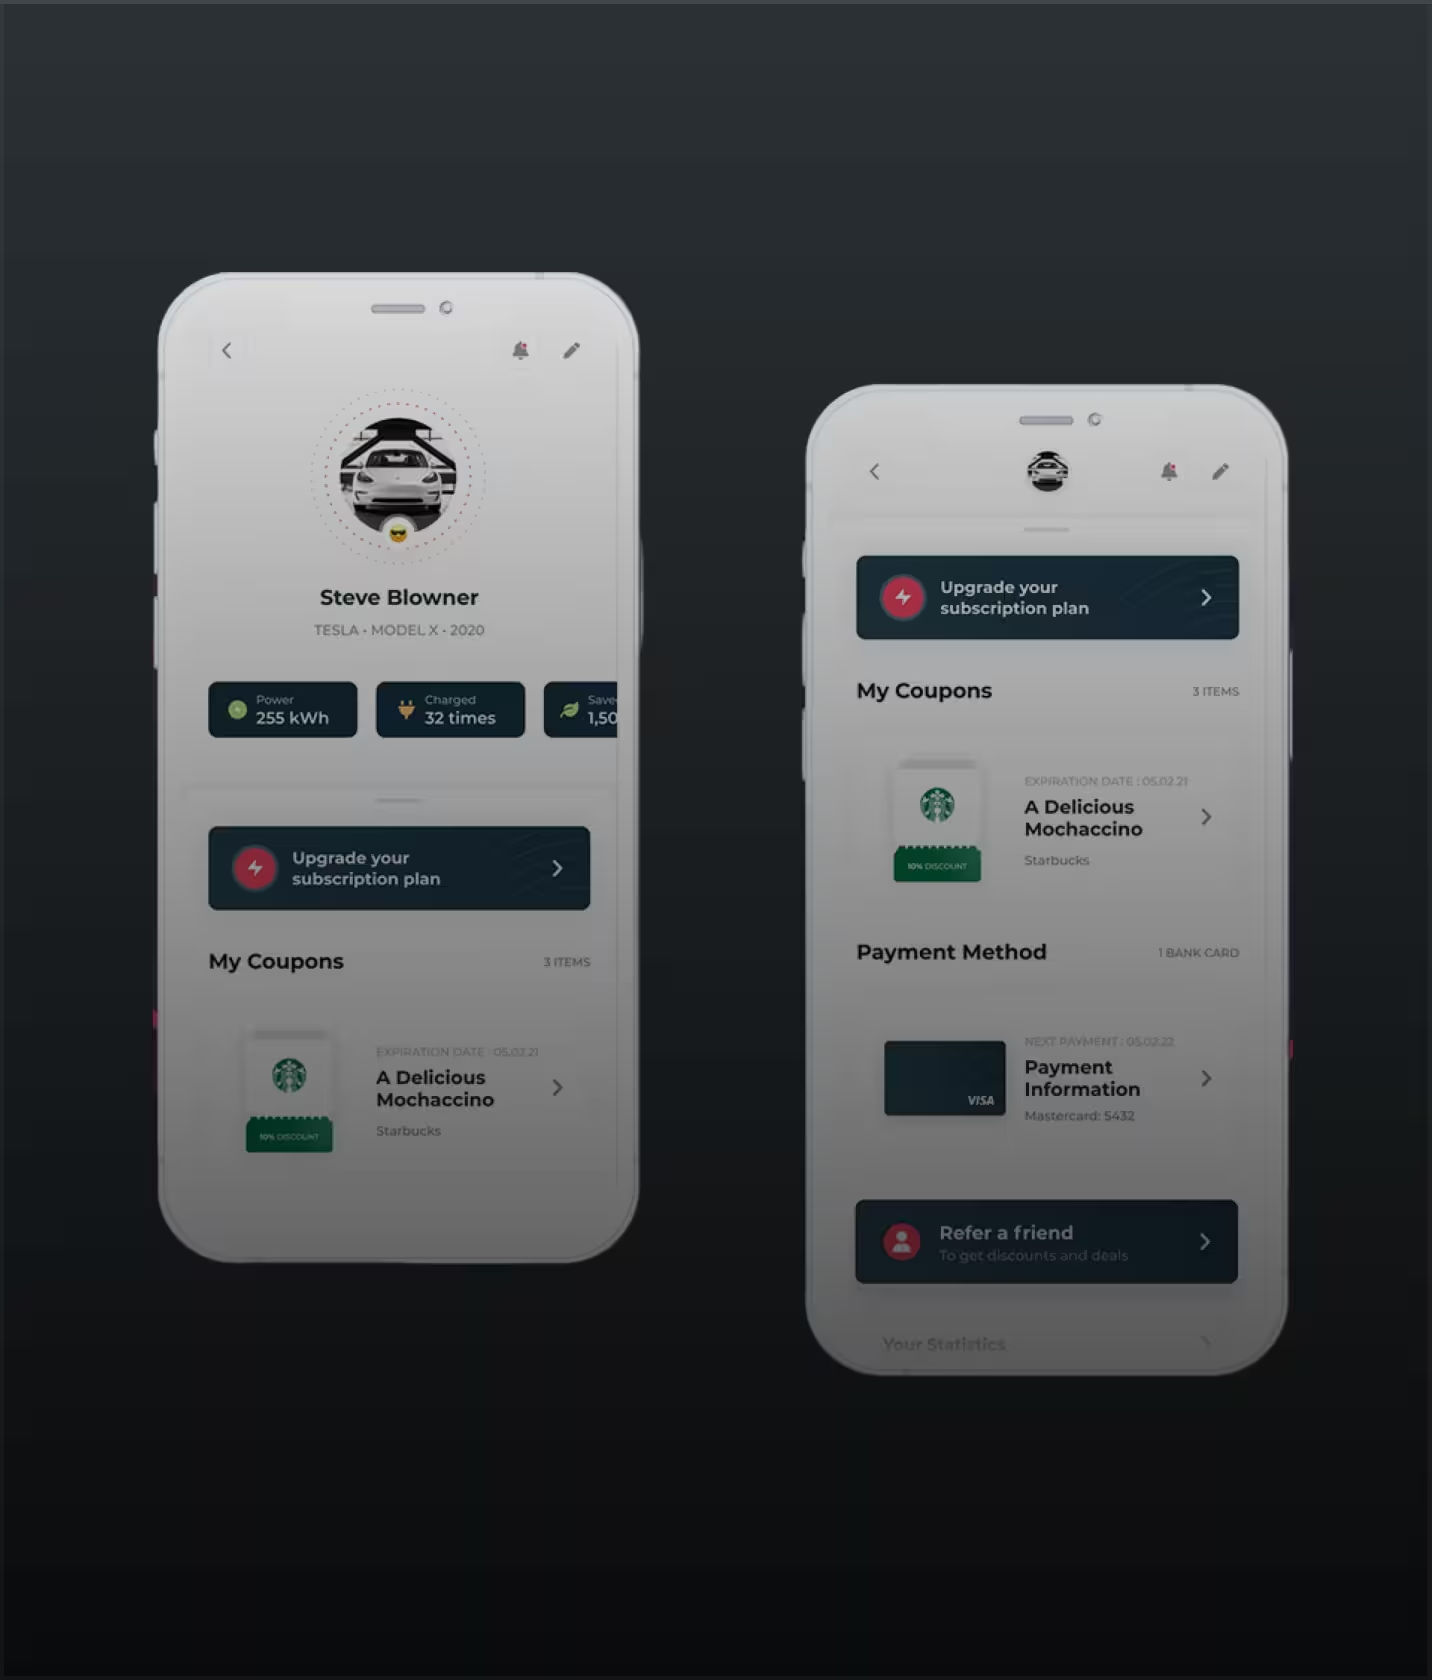

"Glow Design Agency provided UI and UX design services for e-cars charging market company. They were tasked with designing the UX and UI of the app's prototype."
Max Grollmann·Managing Director
View story

"Glow was hired by an e-commerce platform for their UI/UX design services. They redesigned website and provided support. After the new website was launched, the client saw a significant increase in conversions."
Vinicius Rodrigues·CTO at E-Commerce Platform
From analytics dashboards to AI-powered data platforms - our data product design work spans every type of data-heavy product.
Full analytics platforms - from query builders and exploratory data interfaces to shareable dashboards and automated reporting tools.
BI dashboards designed for the full range of business users - from data analysts who need detailed exploration to executives who need one clear number.
SaaS products where data is central to the value proposition - financial tools, operational platforms, performance monitoring systems, and data-enriched workflow products.
Analytics and intelligence platforms that use AI to surface insights, generate predictions, and automate analysis - designed so AI output is trustworthy and actionable.
Analytics features embedded in existing products - dashboards, reports, and data displays designed to match the host product's UX while meeting the specific needs of data presentation.
Want to evaluate your existing data product?
Data product design is the practice of designing interfaces and experiences for products where data is the core value - analytics platforms, BI dashboards, reporting tools, and data-heavy SaaS. It requires expertise in information hierarchy, data visualization principles, and the specific cognitive demands of helping users understand and act on complex information.
Data product design is the practice of designing interfaces and experiences for products where data is the core value - analytics platforms, BI dashboards, reporting tools, and data-heavy SaaS. It requires expertise in information hierarchy, data visualization principles, and the specific cognitive demands of helping users understand and act on complex information.
We research both user types specifically, map their different information needs and workflows, and design role-based views and progressive disclosure mechanisms that serve each group without forcing compromise. Analysts get access to the full data complexity they need. Executives get the clear summaries and key metrics they actually want to see.
We research both user types specifically, map their different information needs and workflows, and design role-based views and progressive disclosure mechanisms that serve each group without forcing compromise. Analysts get access to the full data complexity they need. Executives get the clear summaries and key metrics they actually want to see.
A focused engagement covering one primary dashboard or analytics flow typically runs 6-8 weeks. A full data product design covering multiple user roles, complex data taxonomy, and a complete design system typically runs 10-14 weeks.
A focused engagement covering one primary dashboard or analytics flow typically runs 6-8 weeks. A full data product design covering multiple user roles, complex data taxonomy, and a complete design system typically runs 10-14 weeks.
Yes. Chart type selection, color systems for data, axis design, uncertainty visualization, and the specific data visualization patterns appropriate for your data types are all part of our data product design work. We apply data visualization principles rigorously - because poor visualization in data products generates the wrong decisions.
Yes. Chart type selection, color systems for data, axis design, uncertainty visualization, and the specific data visualization patterns appropriate for your data types are all part of our data product design work. We apply data visualization principles rigorously - because poor visualization in data products generates the wrong decisions.
Yes. We start with a UX audit of your current product - including usability testing with representative users from each user type - to understand where the product is failing before we redesign anything. Data product redesigns that skip this step often perpetuate the same problems in a different visual style.
Yes. We start with a UX audit of your current product - including usability testing with representative users from each user type - to understand where the product is failing before we redesign anything. Data product redesigns that skip this step often perpetuate the same problems in a different visual style.
Figma files covering all screens and data-specific states (loading, empty, error, filter-applied), a data product component library with chart components and data table patterns, developer specs, user research findings from multi-role data user research, and usability test results.
Figma files covering all screens and data-specific states (loading, empty, error, filter-applied), a data product component library with chart components and data table patterns, developer specs, user research findings from multi-role data user research, and usability test results.





We use cookies to see how the site is used and to measure our ads. You choose. Privacy Policy